



Today's realities in the oil market require oil producing companies to be able to respond flexibly to changing conditions: to quickly reduce or increase production volumes. Looking at the headlines of news YouTube channels in the spring of 2020, it is obvious what role the ability to promptly calculate the economics of wells plays. In another of our case studies, we wrote about the creation of a digital twin of an oil field for one of the major oil producing companies. This project is a continuation of our work with this company.
Task and data analysis
The business customer came to us with a question: how is it possible to reduce well downtime, which last year reached up to 10% of production?
We analyzed data for the previous period: what indicators the company collects, and how the planning of repair crew operations is carried out. As a result, we obtained data for the past year with 3-hour detail: the location and status of crews, how much oil was produced and how much was lost due to well downtime. Based on failure statistics, we identified 40 types of repair work and calculated the average repair time for each type of failure.
Based on the analysis, we understood that the classical classification of incidents and working with repair time statistics do not allow us to obtain a practically applicable calculation methodology, since the duration of each repair depends on the distance of the crew from the well, the availability of a spare parts kit for the crew, weather conditions, and the specific operating characteristics of a particular well. Simulation modeling would allow us to take these constraints into account in the calculations and to reflect in detail the operation and repair of wells in a risk-free environment.
Base model
The base model reproduces the statistics on repair crew movements over the past year. Visualization of the movements made it possible to identify suboptimal routes and to create a baseline for comparative analysis – the movement of repair crews under the management of the customer's specialists. It was also noticed that the crews work unevenly: they are often idle, and sometimes work in emergency mode.
We analyzed the model and determined how to optimize the crew scheduling process: to shift some planned repairs in order to minimize downtime and reduce peak load. The simulation results were used to create an optimization system.
Model optimization
To optimize the movements, we applied the branch and bound method, which has proven itself well for solving transportation problems. The list of tasks was divided into blocks of 10 days, and the tasks from each block were distributed among available crews. In turn, each crew was assigned the wells that needed to be checked within 10 days. Using the branch and bound method, the traveling salesman problem was solved for each crew – the minimum-distance plan for visiting the wells was calculated.
We implemented this planning algorithm and obtained a new model created for the same conditions: period, plans, roads used, production pauses, failures, and repair durations. As a result, the new model did not show a potential gain: the results differed from the base model by 1-2%, which is comparable to the simulation error.
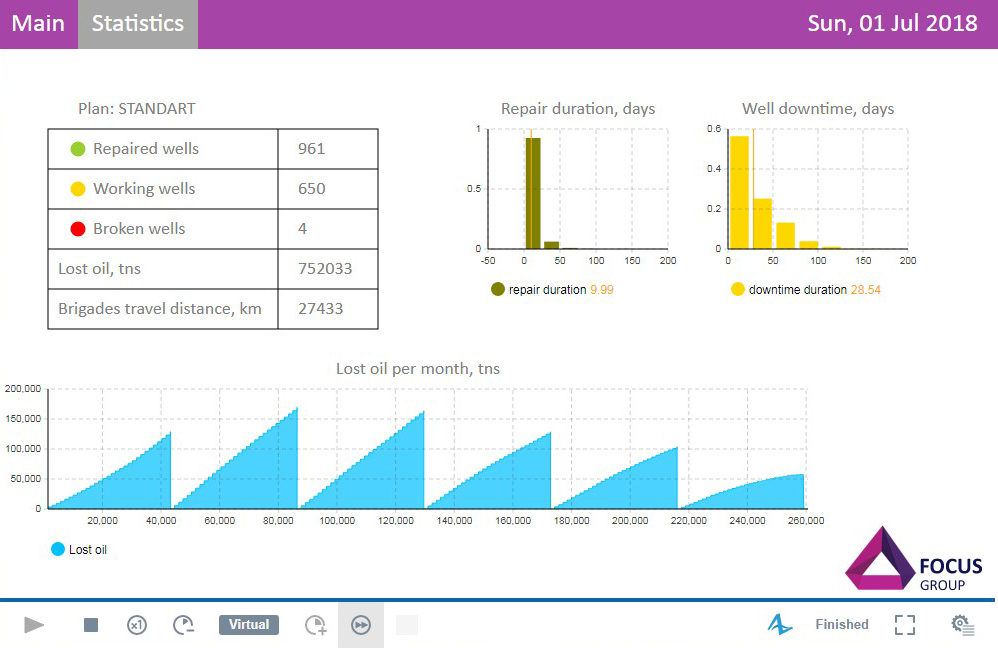
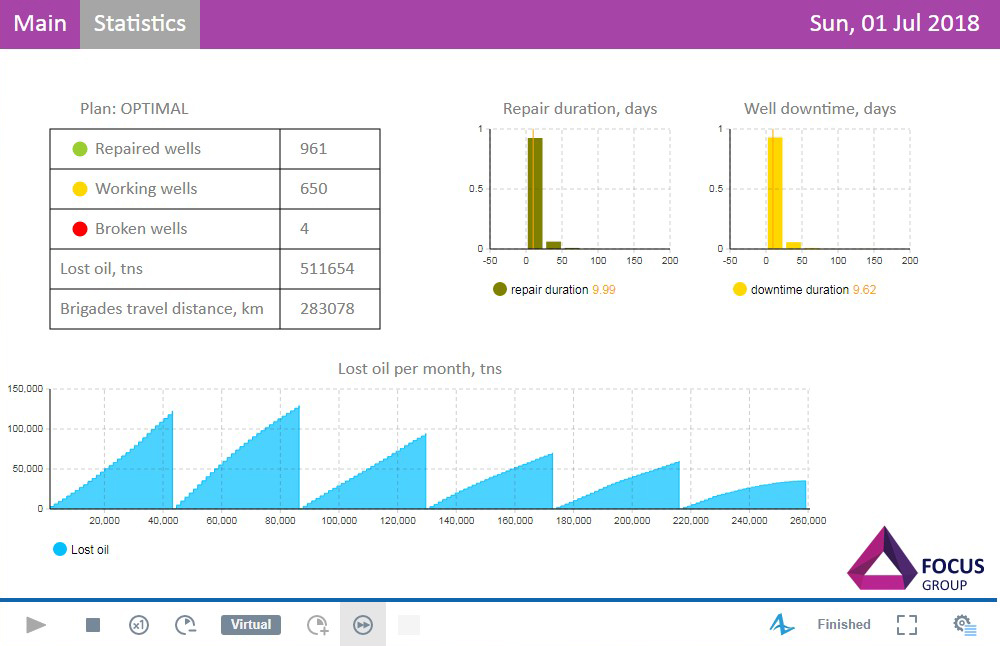
We were surprised by such results of the algorithm's operation, verified the correctness of the algorithm's implementation, performed repeated calculations, and discussed the results within the team. In the end, we developed our own heuristic algorithm, which made it possible to achieve a 32% reduction in the volume of lost oil.
How do optimization and simulation complement each other?
Optimization is performed everywhere: there are many general and specialized packages for optimization, both commercial and open source. They are based on complex mathematics, for example, genetic algorithms, linear and integer programming. The result of their work is a plan, a schedule, a sequence of operations, flows through graph nodes.
But how can one verify that the resulting plan is feasible? How will a complex production or logistics system behave while operating according to this plan? After all, unexpected bottlenecks, problems, and constraints may arise. This is where simulation modeling comes to the rescue. Visualization, feasibility checking, stability of the result under random deviations from the plan, calculation of indicators for the optimized plan or schedule – these are typical tasks set for a dynamic model.
AnyLogic performs very well in this kind of use, as it has an open interface. The model can be easily parameterized by an Excel file obtained as a result of optimization, and can read data from any external database. The model can be exported as a Java application, launched from a third-party program, and parameterized from a database. Conversely, third-party algorithms written in Java, C++, and Python can be called from the model. A model in AnyLogic can be integrated with virtually any optimizer.
Calculation of the optimal crew assignment plan in Python
The proprietary algorithm was written in Python; the Pandas package was used for data processing. Key stages of the algorithm:
- The list of well repair tasks is divided into blocks of 10 days.
- Tasks from each block are distributed among crews. Crews that are available and able to reach the well by the repair date without creating additional well downtime are filtered out.
- Each well from the list is assigned the nearest available crew.
- After assignment, the crew's location and the time when it will become available are updated. The crew's release time is calculated based on the planned repair duration.
- If, after completing a repair, a crew is idle for more than 5 days, it is sent to the base.
- The calculation is repeated.
In this way, all tasks from a 10-day block are distributed, and each crew is assigned a list of wells and a route plan for visiting them.
Result
As a result of the project, the customer received a tool that allows them to promptly coordinate crew operations in order to achieve higher oil production indicators, minimize crew mileage, and obtain greater profit from the group of fields.
You can view the model itself in AnyLogic Cloud.
View a simplified model based on the project in AnyLogic Cloud
We recommend using the built-in scenario comparison function to see the difference between the base and optimized scenarios.
The result of the Python script is a crew-to-well assignment plan in Excel format. After that, the standard and optimal plans are loaded into the simulation model, where the results are compared. The simple heuristic ultimately makes it possible to reduce the average well downtime from 28.5 days to 9.6 days, and the volume of lost oil by 32%.